

Introduction
People with diabetes need to take regular blood glucose measurements to manage their disease. In addition to self-monitoring of blood glucose (SMBG), continuous glucose monitoring (CGM) has become widely accepted as a method of assessing glucose levels in recent years.
Indeed, CGM was primarily developed for people with diabetes. CGM enables comprehensive assessment of glycaemic excursions in real time; several CGM studies focusing on CGM accuracy or glycaemic course in people with diabetes have been published [Pickup 2011, Haak 2017, Beck 2017, Heinemann 2018]. New low-cost CGM devices and simple application have led to CGM systems becoming attractive as a health and lifestyle product for people without diabetes, for example for monitoring nutritional behaviour during weight loss [Vettoretti 2018, Holzer 2022, Klonoff 2022]. Many people are unaware of the varying effects of different foods on glucose levels, so data obtained by CGM may prove useful in assisting dietary adjustment [Kröger 2021].
Previous studies have shown a relationship between elevated postprandial glucose levels and increased risk of developing cardiovascular and metabolic diseases [DECODE Study Group 2001, Hanefeld 1996, Blaak 2012]. A long-term change in dietary habit therefore remains key to prevention and management in metabolic disorders such as overweight, obesity, and diabetes [Blaak 2012, Deutsche Diabetes Gesellschaft 2018, American Diabetes Association 2022, Kopp 2020].
Studies examining postprandial glucose profiles in terms of meal composition in individuals without diabetes using CGM have been published [Gonzalez-Rodriguez 2019, Rohling 2019, Mendes-Soares 2019, Freckmann 2007]. However, there are limited CGM data on postprandial glucose excursions in individuals without diabetes from studies including the impact of meal sequence in relation to nutritional composition in meals.
- AUC areas under curves
- BMI body mass index
- CGM continuous glucose monitoring
- CHO carbohydrates
- IQR interquartile ranges
- SMBG self-monitoring of blood glucose
- SEM standard errors of mean values
- SD standard deviation
- TM test meal
Current guidelines for type 2 diabetes mellitus therapy and prevention primarily recommend lifestyle interventions that support weight loss [Deutsche Diabetes Gesellschaft 2018, American Diabetes Association 2022]. No general eating pattern recommendations exist (such as a low-carbohydrate diet), and meal planning was to be individualised according to current eating patterns, preferences, and metabolic goals [American Diabetes Association 2022, Evert 2019]. Identifying food and meals that suppress hunger and promote satiety would therefore aid prevention of obesity and type 2 diabetes mellitus [Yan 2017].
The aim of this study was to evaluate the capability of CGM to monitor the effect of different orders of meals containing standardised amounts of carbohydrates but with varying protein and fat content on postprandial glucose profiles and subsequent eating behaviour in individuals without diabetes.
Materials/Participants and Methods
The present open, mono-centre study was conducted between January and March 2018 at the Institut für Diabetes-Technologie Forschungs- und Entwicklungsgesellschaft mbH an der Universität Ulm (IfDT) in Germany. All local regulations and good clinical practice requirements were met. The competent ethics committee approved the study protocol, and the study was registered at clinicaltrials.gov (NCT03405415). All participants gave their informed consent before commencing study procedures.
The main aim of this study was to assess the effects of meal sequence and nutritional content on postprandial glycaemic responses. The second aim was to examine the effect of meal sequences on the subsequent eating behaviour and satiety.
We also analysed the study data with respect to glucose profiles throughout the day; this analysis has been published elsewhere [Freckmann 2022].
Participants
All participants signed their informed consent before any study procedures began and were only enrolled after a screening visit if they fulfilled the eligibility criteria (age ≥18 years and willingness to abstain from medications containing salicylic acid or ascorbic acid during the study period). Exclusion criteria included: history of known diabetes, acute or severe chronic illness, pregnancy or lactation, or any barriers to sufficient understanding of the study procedures. Thirty-six adult participants without diabetes were included in the evaluation. Each participant underwent an oral glucose tolerance test to confirm absence of diabetes at the beginning of the study.
Study design and procedures
Each participant wore two sensors in parallel from an intermittent-scanning CGM system (FreeStyle® Libre; Abbott Diabetes Care Ltd., Witney, UK). This CGM system measures glucose levels every minute in the interstitial fluid and continuously stores one value every fifteen minutes for up to fourteen days. The CGM system needs to be actively scanned using a handheld reader device in order to obtain continuous glucose data over this period. Participants were asked to perform regular scans to retain the whole daily glycaemic data.
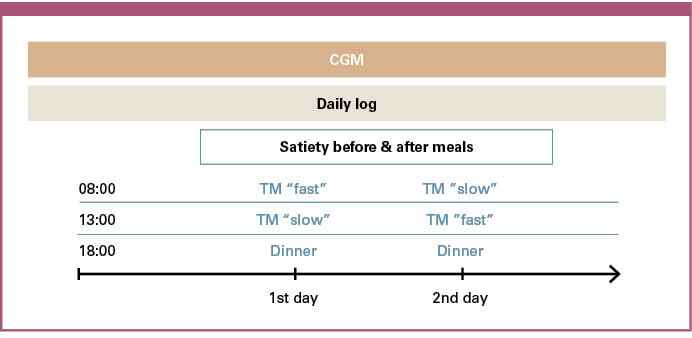
Participants visited the study site on two consecutive days from 07:30 to 19:30 (days 4 and 5 after CGM sensor insertion) for outpatient dietary intervention (Figure 1).
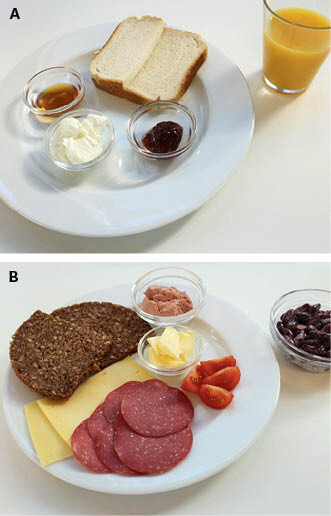
Dietary intervention consisted of standardised meals for breakfast (08:00) and lunch (13:00) and free-choice dinner from a buffet (18:00). Additional meal intake, carbohydrate-containing beverages, and physical exertion were not permitted. The test meals (TMs; TM "fast" and TM "slow") have already been investigated in previous study settings to assess glucose profiles in healthy individuals [Freckmann 2007] and in people with type 1 and type 2 diabetes (not published). Both meals contained equal carbohydrate amounts (50 g), but TM "fast" was designed for fast glucose absorption (80 % carbohydrates, 8 % fat, 12 % protein, 1,048.4 kJ (250.4 kcal); wheat toast bread, honey, jam, cream cheese, orange juice), whereas TM "slow" was designed for slow glucose absorption (27 % carbohydrates, 56 % fat, 17 % protein, 3,090.0 kJ (738.0 kcal); whole-meal bread, liver sausage, gouda, salami, butter, kidney beans with olive oil and cream, tomatoes) (Figure 2). Participants received TM "fast" for breakfast and TM "slow" for lunch on one day, and TM "slow" for breakfast and TM "fast" for lunch on the other day. The meal sequence on the first intervention day was randomly assigned to the participants, and the other meal sequence was assigned for the second intervention day. Dinner was selected from a buffet by the participants themselves. The meal content and amount were free-choice, and nutrient content was determined by a dietician prior to consumption. In addition, participants rated their feeling of satiety directly before each meal on a scale ranging from −3 (extremely hungry) to +3 (extremely satiated) based on the visual analogue scale by Holt et al. [Holt 1995]. Participants left the study site in the evening of the intervention days and were asked to refrain from any further carbohydrate consumption or strenuous physical activity.
Participants arrived late at the study site in two cases. All study procedures were delayed by thirty minutes for these two participants.
Data preparation
CGM data from sensors worn simultaneously were retrospectively re-calibrated based on SMBG data and subsequently combined to yield a single glucose trace per participant in order to increase the reliability of the glucose data and reduce the influence of measurement error. The resulting SMBG-adjusted CGM glucose concentration traces per participant are hereinafter referred as glucose traces. See [Freckmann 2022] for details on the CGM data adjustment procedure.
Data analysis
A two-hour window after start of meal consumption was used to calculate postprandial glucose peak concentrations, time to peak, and glucose increase compared to pre-meal glucose levels. Postprandial glucose peaks were defined as a rise in glucose concentration of at least 15 mg/dl within two hours after meal consumption compared to pre-prandial glucose levels. Pre-prandial glucose levels were defined as glucose concentration eight minutes before meal intake.
Results for glucose concentrations across all patients are given as medians with interquartile ranges (IQRs). Hourly postprandial areas under the curve (AUCs) above pre-prandial values were calculated for five hours after meal intake using the trapezoidal rule with mean values ± standard errors of mean values (SEMs) provided [Allison 1995].
Energy and macronutrient intake was calculated as mean ± standard deviation (SD) for each meal. An explorative Student’s t-test was performed to compare energy intake from dinner to establish whether a clinically relevant difference was also statistically significant.
Results
Demographic data
Twenty-one of the thirty-six analysed participants without diabetes were female, and fifteen were male. On average, participants were 23.7 ± 5.7 years old (mean ± SD; range: 18 to 52 years) at an average HbA1c of 5.2 ± 0.2 % (33.0 ± 2.2 mmol/mol) and mean BMI of 23.8 ± 3.5 kg/m² (range: 19.4 to 30.6 kg/m²). The estimated daily energy requirement during meal intervention days (sedentary lifestyle; physical activity level 1.2) was 8,337.2 ± 1,446.6 kJ (1,991.2 ± 345.5 kcal).
Postprandial glucose traces after breakfast and lunch depending on different meal sequences
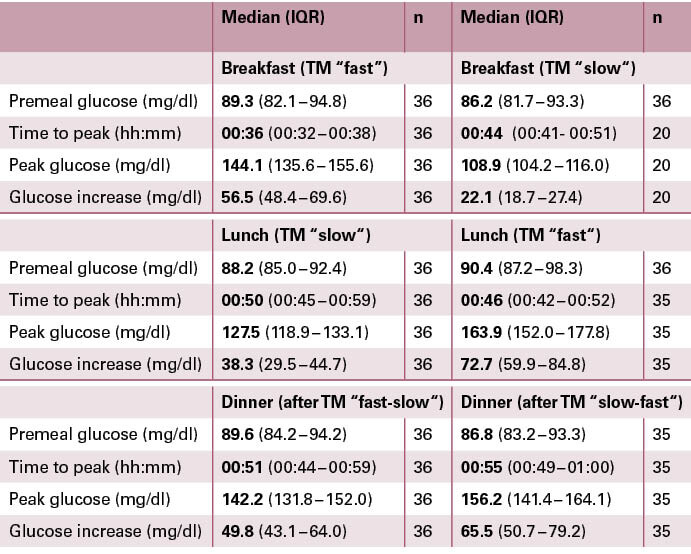
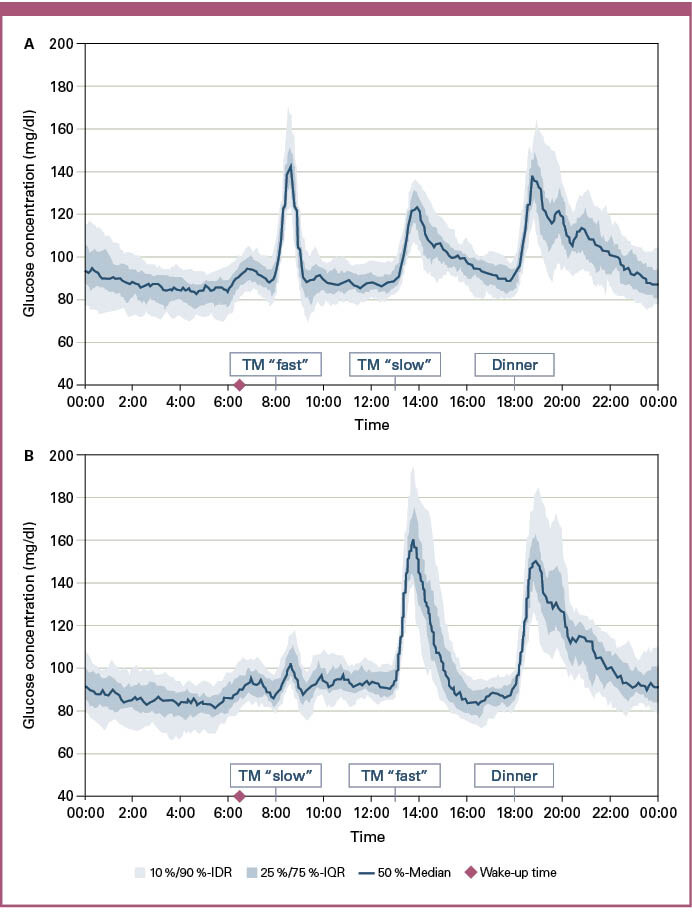
Figure 3 presents participants’ glucose traces on days with standardised meal intake for breakfast and lunch and a free-choice meal for dinner. Fasting glucose values were comparable on both days (medians: 89.3 mg/dl and 86.2 mg/dl). See Table 1 for detailed results with IQRs. Glucose traces reached their peak after a median duration of 36 minutes with a median increase of 56.5 mg/dl after TM "fast" for breakfast (Figure 3A). In contrast, TM "slow" for breakfast with the same carbohydrate content induced a median glucose trace increase of 22.1 mg/dl after a median duration of 44 minutes (Figure 3B).
Similarly, TM "fast" for lunch induced a higher glucose trace increase than TM "slow" for lunch (increase of 72.7 mg/dl vs. 38.3 mg/dl) (Table 1).
Glucose increase was higher after TM "slow" for lunch than for breakfast (median 38.3 mg/dl vs. 22.1 mg/dl), leading to a peak glucose level of 127.5 mg/dl. The corresponding differences in glucose increase after TM "fast" for lunch and breakfast were even greater (median 72.7 mg/dl vs. 56.5 mg/dl), leading to a peak glucose concentration of 163.9 mg/dl after lunch (Table 1).
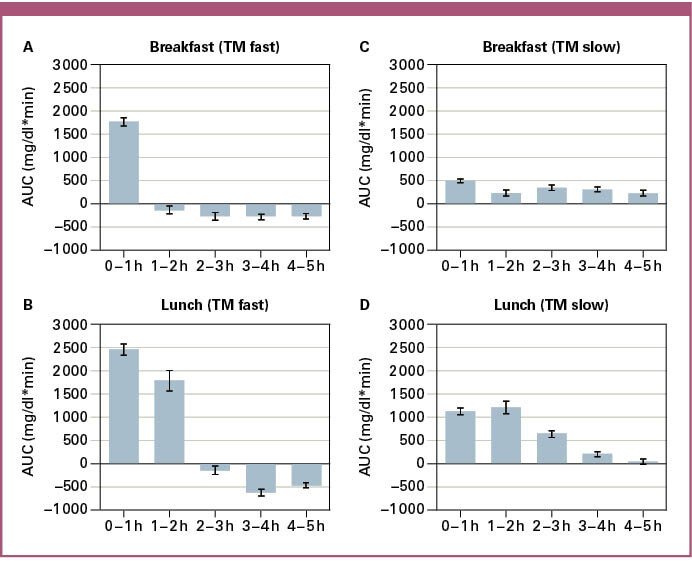
Figure 4 shows AUCs for five hours after meals on the two days with contrasting meal sequences. Pre-prandial glucose levels after TM "fast" for breakfast were reached within an hour (Figure 4A). TM "fast" for lunch led to a more pronounced, longer-lasting increase and lower glucose levels in the following hours (Figure 4B). TM "slow" for breakfast showed constantly elevated glucose concentrations for the following five hours (Figure 4B) in contrast with a more curved course after TM "slow" for lunch (Figure 4A).
Mean satiety before lunch was higher when TM "slow" was consumed for breakfast compared to TM "fast" for breakfast (−1.0 vs −2.1; (−3 = extremely hungry; +3 = extremely satiated)).
Energy intake and postprandial glucose traces after dinner depending on contrasting meal sequences
Participants consumed a total of 4,138.4 kJ (988.4 kcal) for breakfast and lunch after combining "fast" and "slow" TMs. Mean satiety directly before dinner was −1.5 after the TM "fast" for breakfast and "slow" for lunch sequence. Participants were free to choose the type and amount of food for dinner, which lead to a mean energy intake of 4,429.8 ± 1,205.4 kJ (1,058.0 ± 287.9 kcal) (mean carbohydrate intake: 89.3 ± 28.6 g). In the reverse TM sequence ("slow" for breakfast, "fast" for lunch), participant satiety before dinner was −2.4 and, on average, 628.8 ± 582.4 kJ (150.2 ± 139.1 kcal) more was consumed for dinner (5,058.3 ± 1,787.8 kJ (1,208.1 ± 427.0 kcal); p = 0.0013) (mean carbohydrate intake: 98.0 ± 34.6 g). The increased hunger after the "slow-fast" TM sequence was associated with a slightly lower glucose concentration directly before dinner (86.8 mg/dl vs 89.6 mg/dl for TM sequence "fast-slow"; Table 1). The daily energy requirement calculated (8,337.2 ± 1,466.6 kJ (1,991.2 ± 350.4 kcal)) was exceeded with both TM sequences (104 % and 111 %, respectively). The nutrient ratio for dinner did not differ (33.9 % / 34.4 % carbohydrates, 47.8 % / 47.2 % fat, 18.3 % / 18.4 % protein).
In the "fast" for breakfast and "slow" for lunch TM sequence, the median postprandial peak glucose increase after dinner was 49.8 mg/dl with a median glucose peak of 142.2 mg/dl observed (mean carbohydrate intake was 89.3 ± 28.6 g). The median glucose increase and peak after dinner were higher in the reverse sequence of "slow" for breakfast and "fast" for lunch (glucose increase: 65.5 mg/dl; glucose peak: 156.2 mg/dl; mean carbohydrate intake was 98.0 ± 34.6 g) (Table 1).
Discussion
The present study has demonstrated that CGM is able to visualise postprandial glucose profiles in people without diabetes after consumption of alternating meal sequences with standardised nutritional composition, thus supporting the use of CGM in non-diabetic people. The application of CGM in people with diabetes to assess glucose data has been shown to be useful in optimizing glucose management and achieving glucose targets [American Diabetes Association 2022, Ogawa 2021, Gandhi 2011]. CGM systems were initially developed for people with diabetes, but this investigation suggests that this technology could also be valuable for integration into the everyday lives of people without diabetes as it allowed a distinction between meals of varying nutritional content and demonstrated the impact of a previous meal on subsequent eating behaviour. Awareness of glucose responses from different foods may be useful in cases such as weight-loss programmes towards individual dietary adjustment according to glucose profiles recorded for people combating obesity.
The glycaemic profiles reported in this study after consumption of standardised meals with identical carbohydrate amounts (50 g) have shown that not only the carbohydrate content but also other meal components, such as fat and protein content, require consideration when focusing on postprandial glucose [Bell 2015, Vetrani 2022]. The highest postprandial glucose traces were seen after TM "fast" in this study. This TM was quickly digested as it mainly consisted of simple carbohydrates and low fat and protein content. The AUCs after consumption of TM "fast" were highest within the first hours, followed by a rapid decline. TM "slow" included complex carbohydrates, high fat content, and slightly higher protein content compared to TM "fast". TM "slow" caused a low and prolonged postprandial glucose increase compared to TM "fast"; glucose values had not even returned to baseline five hours after meal intake. These results tally with other study results demonstrating that carbohydrate complexity and meal composition itself influence the magnitude and extent of postprandial glucose changes due to varying digestion and intestinal absorption capability. Meals with rapidly absorbed carbohydrates and low fibre content therefore induce a rapid increase in postprandial glucose [Rohling 2019, Ando 2018, Riccardi 2008].
The AUC was larger and glucose traces were higher after lunch than after breakfast in TM "slow". This finding contrasts with a previous study that we conducted in 2007 [Freckmann 2007], where TM "slow" for breakfast led to higher glucose excursions and AUC in comparison to lunch. One possible explanation for this effect may be that the participants in the present study arrived at the study site in the morning, which required at least a low level of physical activity. In contrast, participants in the 2007 study stayed overnight and only saw negligible levels of activity between getting up and having breakfast. Low-intensity physical activity may improve postprandial glycaemic response in individuals without diabetes as reported by Büsing et al. and Fencher et al. [Busing 2019, Fechner 2020].
The delayed glycaemic response and low peak after TM "slow" with high fat content tallies with our previous analysis in 2007 [Freckmann 2007] and another study result focusing on the impact of dietary fat in people with type 1 diabetes mellitus [Bell 2015]. Apart from that, TM "slow" contained more fibre than did TM "fast"; fibre has been reported to increase gastrointestinal content, decrease gastric emptying rates, and reduce the glucose absorption rates [Gonzalez-Rodriguez 2019, Scazzina 2013].
Additionally, protein preload has been reported to blunt glycaemic response to a subsequent high-carbohydrate meal [Meng 2017, Wolever 1986, Chen 2010]. This effect cannot be judged in the current analysis as proteins were not separately consumed beforehand.
Besides the effect of single meals, meal sequences also seem to be relevant to glycaemic profile in our study. Glycaemic courses differed although the same TMs were consumed and pre-meal glucose levels were comparable when comparing glycaemic data from the "fast-slow" and "slow-fast" sequences for breakfast and lunch. Previous studies have indicated that breakfast meal composition may influence glycaemic response for the subsequent meal [Ando 2018, Kuwata 2016, Jovanovic 2009]. Our results show elevated glycaemic response (on average +17 mg/dl) when TM "slow" was consumed before TM "fast" compared to glucose course after TM "fast" consumption without pre-meal intake. Ando et al. also reported 20 mg/dl increased blood glucose concentrations after previously consuming a high-fat meal [Ando 2018]. Fechner et al. also presented significantly higher glucose responses from a rice meal challenge after a low glycaemic load diet in overweight and slightly obese participants without diabetes; this may be due to physiological adaptation to a low glycaemic eating pattern that only becomes visible when challenged with high glycaemic foods [Fechner 2020].
Similarly, another study has demonstrated that a high-fat breakfast may lead to elevated glycaemic response at lunchtime [Ando 2018].
Apart from that, the glucose metabolism’s circadian rhythm may also influence postprandial glucose course. As nutrient metabolism exhibits a day-night variation, the postprandial response of metabolic functions may depend on the time of meal intake. Time-dependent glucose utilisation regulation causes higher glucose tolerance to be reported in the morning than in the evening in healthy individuals [Aoyama 2020, Johnston 2014, Henry 2020]. As reported by Sutton et al., eating along the metabolism’s circadian rhythms such as through increased food intake at breakfast and reduced intake at dinner improves glycaemic control. These authors’ early time-restricted feeding trials indicated that early time-restricted feeding improves cardiometabolic health factors such as insulin sensitivity and satiety in men with prediabetes. Meal timing may therefore also impact the development of metabolic disorders [Sutton 2018].
The specific and rather uncommon TM composition represents a limitation to this study. However, the TMs were chosen according to previous analyses assessing glucose profiles in healthy [Freckmann 2007] and people with type 1 and type 2 diabetes after consumption of the same TM. We opted to use the identical TM for the present evaluation for us to be able to compare the results of each analysis in the next step. Another limitation of the study was the use of a first-generation intermittent-scanning CGM, which may not be as accurate as devices in the current generation. Sufficient CGM accuracy in response to meals in healthy individuals is key to reliable prediction of glycaemic postprandial response and needs to be taken into account when interpreting CGM values. One study compared postprandial CGM accuracy against plasma glucose measurements in healthy participants, demonstrating that CGM significantly underestimates glucose values during eight hours after a meal and that CGM accuracy was dependent on varying macronutrient compositions [Barua 2022]. However, that study only included ten individuals in a study population that consisted of older overweight participants, thus requiring further validation with a larger cohort.
Another limitation of the CGM system used is a potential interference with ascorbic acid (vitamin c) present in orange juice of TM "fast" which might lead to falsely elevated sensor glucose values [Heinemann 2021]; the magnitude of the effect in this study is unkown. However, the amount of orange juice (145 g; equivalent to ~73 mg ascorbic acid) consumed was low.
Energy intake exceeding the energy requirement contributes to the progression of obesity and associated complications such as type 2 diabetes mellitus [American Diabetes Association 2022]. Identifying food and meals that suppress hunger and promote satiety is therefore one of the main interests in obesity and type 2 diabetes mellitus therapy and prevention [Yan 2017, Fallaize 2013]. Glucostatic theory describes a causal relation between short-term appetite regulation and the blood glucose level. According to this theory, high blood glucose levels signal satiety, whereas low glucose levels trigger food intake [Mayer 1953]. In this study, the meal sequence or a previous meal may have influenced the feeling of satiety and energy intake in the subsequent meal. Irrespective of the TM sequence, the same energy content was consumed for breakfast and lunch combined; however, satiety before dinner was lower with TM "fast" consumed for lunch. Energy intake for dinner was also consistently higher. Likewise, satiety was higher before lunch with TM "slow" consumed in advance. TM "slow" promoted the feeling of satiety for a longer period and decreased the risk of an increased energy intake at a subsequent meal. The results support previous studies describing a positive correlation between fat and fibre content and satiation [Yan 2017].
In conclusion, we have demonstrated the potential of CGM as a valuable tool for people without diabetes to monitor nutritional behaviours; CGM was able to reliably reflect postprandial glucose profiles according to the nutritional content of different meals in our study as well as after different sequences of predefined meals, which suggests potential use of this technology in non-diabetic people as a health and lifestyle application. The glycaemic response data as well as the feeling of satiety in relation to specific meals and sequences in individuals without diabetes collected in this evaluation may further contribute towards identifying beneficial dietary patterns with the use of CGM for potential consideration in managing metabolic disorders.
Acknowledgements: The authors would like to thank the study personnel and all volunteers who contributed to the study, and also Dr. Manuel Eichenlaub (IfDT) for his help and feedback in writing the manuscript.
Manuscript received: 12. Dezember 2022
Manuscript accepted: 12. Januar 2023
Conflicts of interest: Guido Freckmann declares membership in the supervisory board/advisory board of Dexcom, Boydsense, Pharmasens; honoraria from Roche, Novo Nordisk, Terumo and funding or project support from Roche, Ascensia. The other authors declare no conflicts of interest.
Erschienen in: Diabetes, Stoffwechsel und Herz, 2023; 32 (2) Seite 61-68